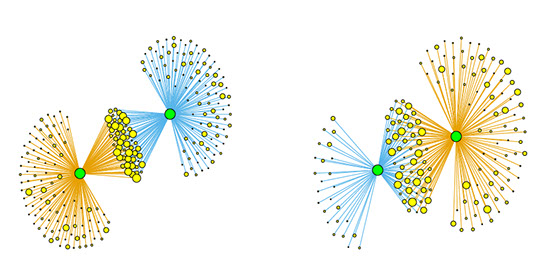
We propose a rigorous method to assess the statistical significance of overlaps between heterogeneously diversified portfolios. Our approach constructs a validated network of financial institutions where links indicate potential contagion channels that are statistically significant—that is, overlaps that exceed what would be expected by chance given the institutions' portfolio characteristics.
The method is implemented on a comprehensive historical database of institutional holdings spanning from 1999 to the end of 2013, though it can be applied to any bipartite network structure. This general applicability makes it valuable beyond finance, with potential applications to ecological networks, trade relationships, and other systems where overlap significance must be assessed.
Our analysis reveals striking temporal patterns. We find that the proportion of validated links—representing significant portfolio overlaps—increased steadily in the years before the 2007-2008 financial crisis and reached a maximum precisely when the crisis occurred. This suggests that systemic risk from fire sale liquidation was maximal at that critical moment, providing empirical support for portfolio overlap as a key mechanism in the crisis.
After a sharp drop in 2008 as institutions adjusted their portfolios, systemic risk resumed its growth in 2009, with a notable acceleration in 2013. This pattern suggests that systemic vulnerabilities rebuilt themselves in the post-crisis period, potentially setting the stage for future instability.
We also demonstrate that the algorithm can identify portfolios particularly exposed to market movements. Market trends tend to be amplified in the portfolios identified by our method, meaning it is possible to obtain an informative signal about which institutions are about to suffer the most significant losses (or enjoy the largest gains) during market downturns or upswings. This predictive capability could be valuable for both risk management and regulatory oversight.